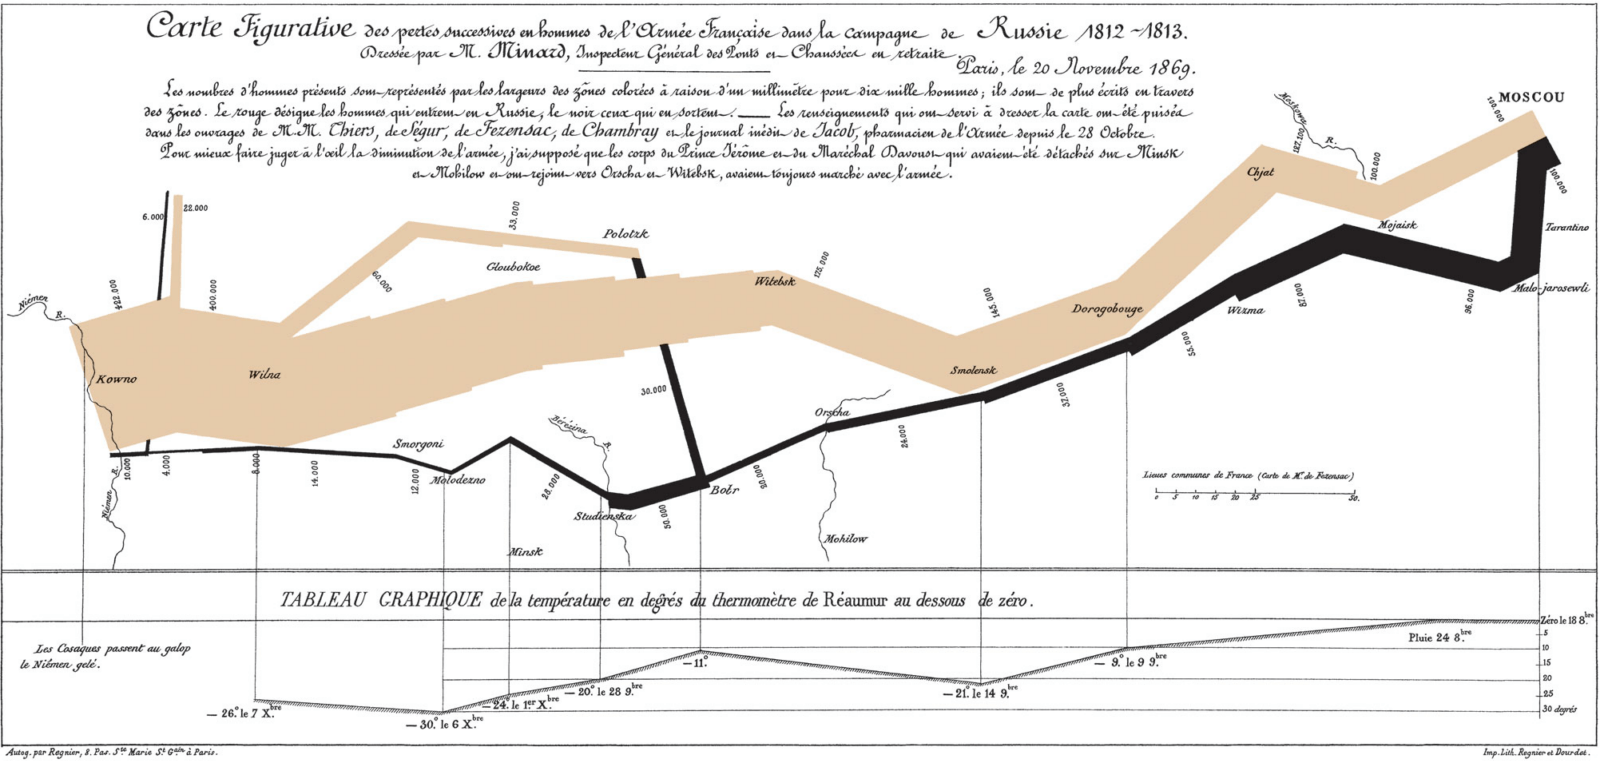
Destruction of Napoleon’s Grande Armée
(Joseph Minard, 1869)
Minard’s graph showing the destruction of Napoleon’s Grande Armée in 1812-1813. You can find an English translation of this graph here. How many types of data are presented on the graph? It is a map, so there are coordinates (not labelled!). There is the width of the line which indicates the size of the army. There is the temperature plotted for the retreat.
Minard’s graph is recognized as one of the greatest. All classrooms discussions of statistics need to showcase such complex, multivariate examples of how to tell a story with data.
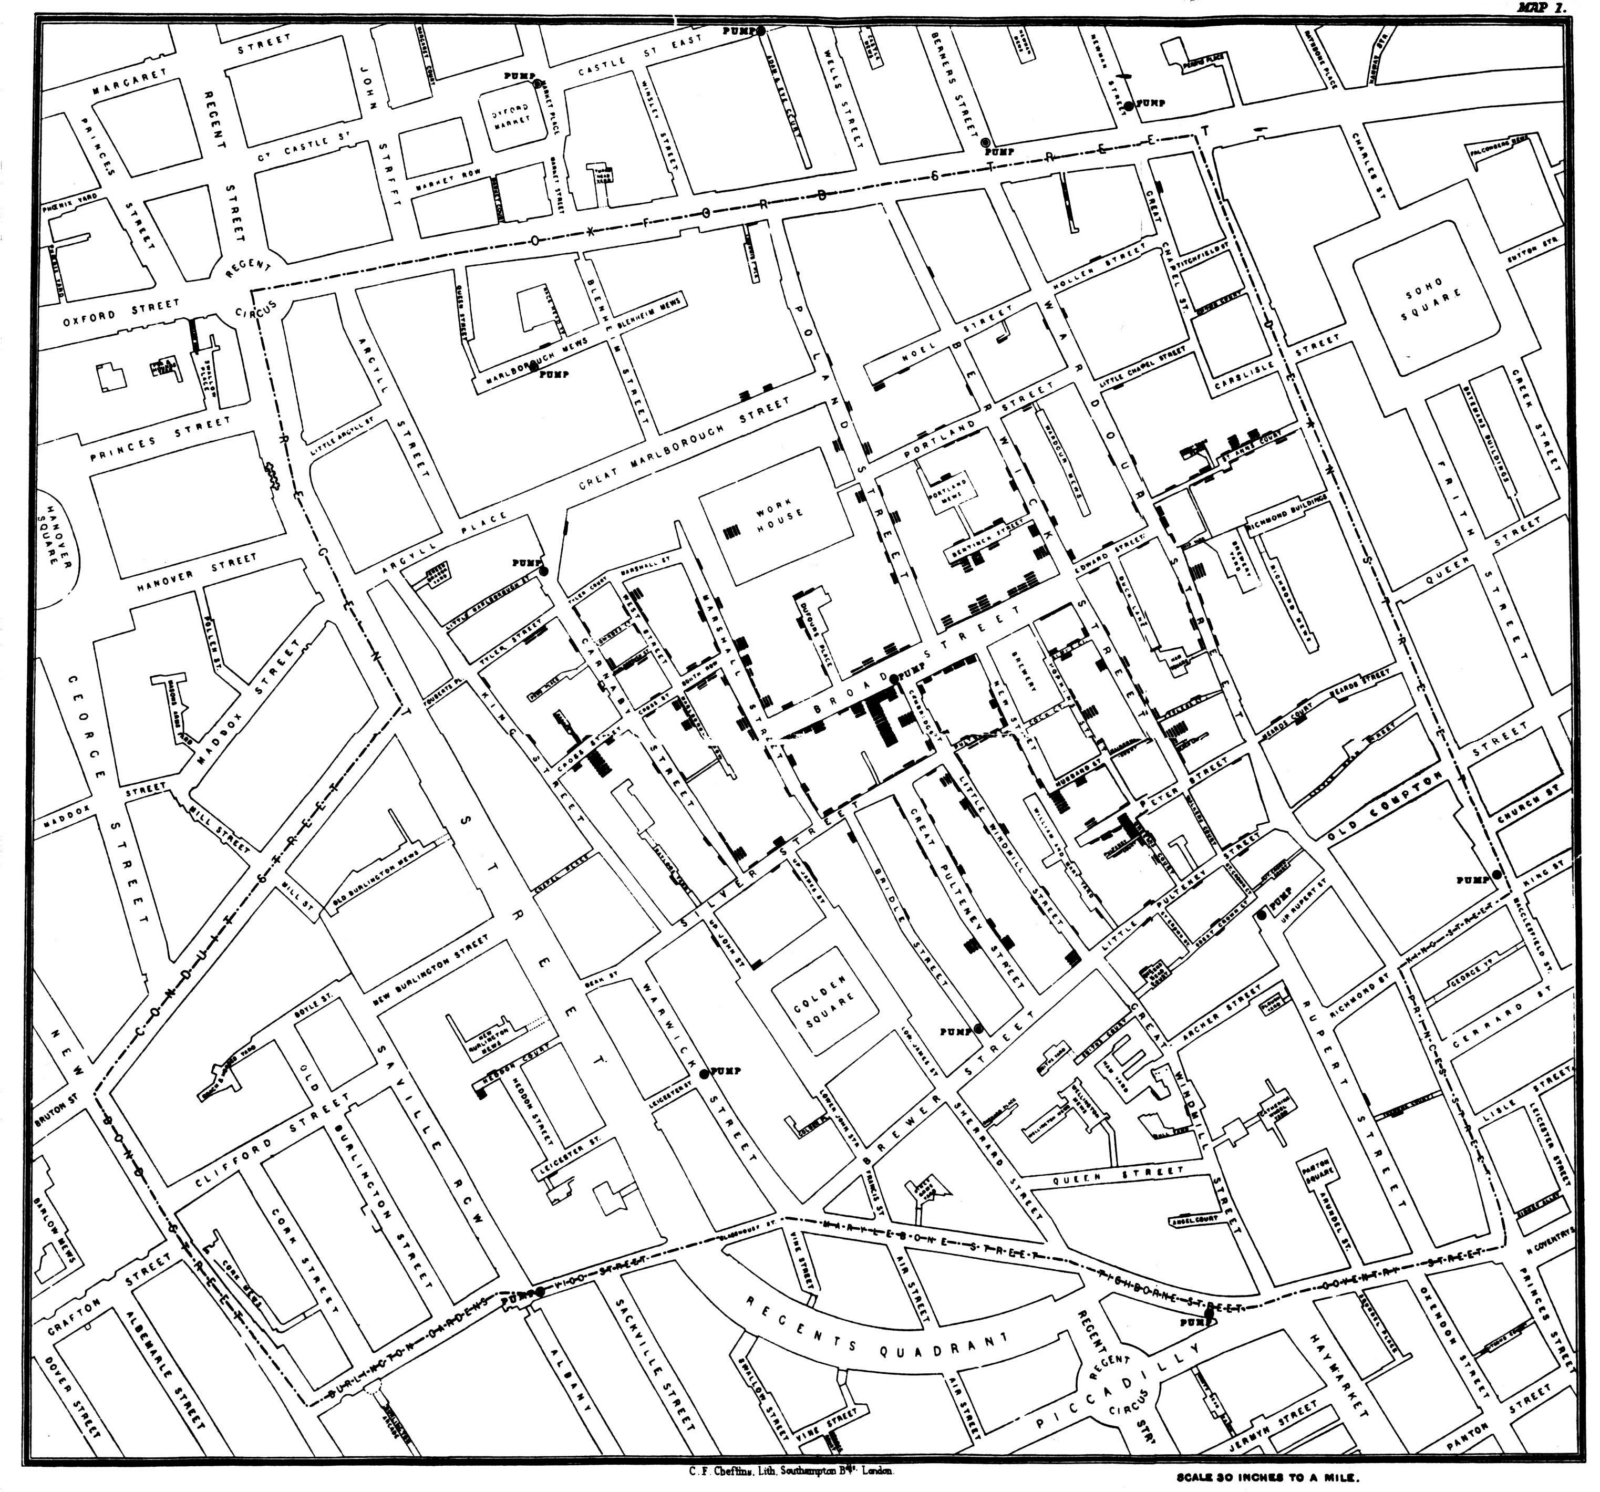
Cholera Epidemic
(John Snow, 1854)
Dr. John Snow collected data on the cholera outbreak in London in 1854. Each line behind a door indicates a death. The prevailing theory was that the sickness was due to bad air. This map pointed to the Broad Street pump as being the culprit, but was this due to a bad smell emanating from the pump – or from something in the water that people were drinking?
The statistically riveting story about this map and the data anomalies (like the brewery workers who stayed healthy) make for a fantastic story for all students of statistics.
Standards for Mathematical Practice
MathPickle puzzle and game designs engage a wide spectrum of student abilities while targeting the following Standards for Mathematical Practice:
MP1 Toughen up!
Students develop grit and resiliency in the face of nasty, thorny problems. It is the most sought after skill for our students.
MP2 Think abstractly!
Students take problems and reformat them mathematically. This is helpful because mathematics lets them use powerful operations like addition.
MP3 Work together!
Students discuss their strategies to collaboratively solve a problem and identify missteps in a failed solution. MathPickle recommends pairing up students for all its puzzles.
MP4 Model reality!
Students create a model that mimics the real world. Discoveries made by manipulating the model often hint at something in the real world.
MP5 Use the right tools!
Students should use the right tools: 0-99 wall charts, graph paper, mathigon.org. etc.
MP6 Be precise!
Students learn to communicate using precise terminology. MathPickle encourages students not only to use the precise terms of others, but to invent and rigorously define their own terms.
MP7 Be observant!
Students learn to identify patterns. This is one of the things that the human brain does very well. We sometimes even identify patterns that don't really exist 😉
MP8 Be lazy!?!
Students learn to seek for shortcuts. Why would you want to add the numbers one through a hundred if you can find an easier way to do it?
Please use MathPickle in your classrooms. If you have improvements to make, please contact me. I'll give you credit and kudos 😉 For a free poster of MathPickle's ideas on elementary math education go here.